
13 min read
An easy look at Prometheus architecture
For me, as a frontend developer, diving into domains that require extensive architectural knowledge can sometimes be challenging. If you're like me, then this article is for you. Here, I'll strive to explain in the simplest terms possible what Prometheus is, and together, we'll take a stroll through its architecture.
What is Prometheus?
In simple terms, Prometheus is a server written in Go that takes in data in a specific format, stores and processes it in a defined manner.
Where and why is Prometheus used?
As computer systems become increasingly complex, manual management becomes challenging. With multiple servers running containerized applications and countless interconnected processes, maintaining smooth operations becomes difficult.
Without insight into hardware and application-level issues such as errors, latency, or resource shortages, identifying and fixing problems becomes time-consuming. In such complex setups, any service or application failure can cascade, leading to overall system unavailability. Quickly pinpointing issues from a multitude of potential sources can be daunting.
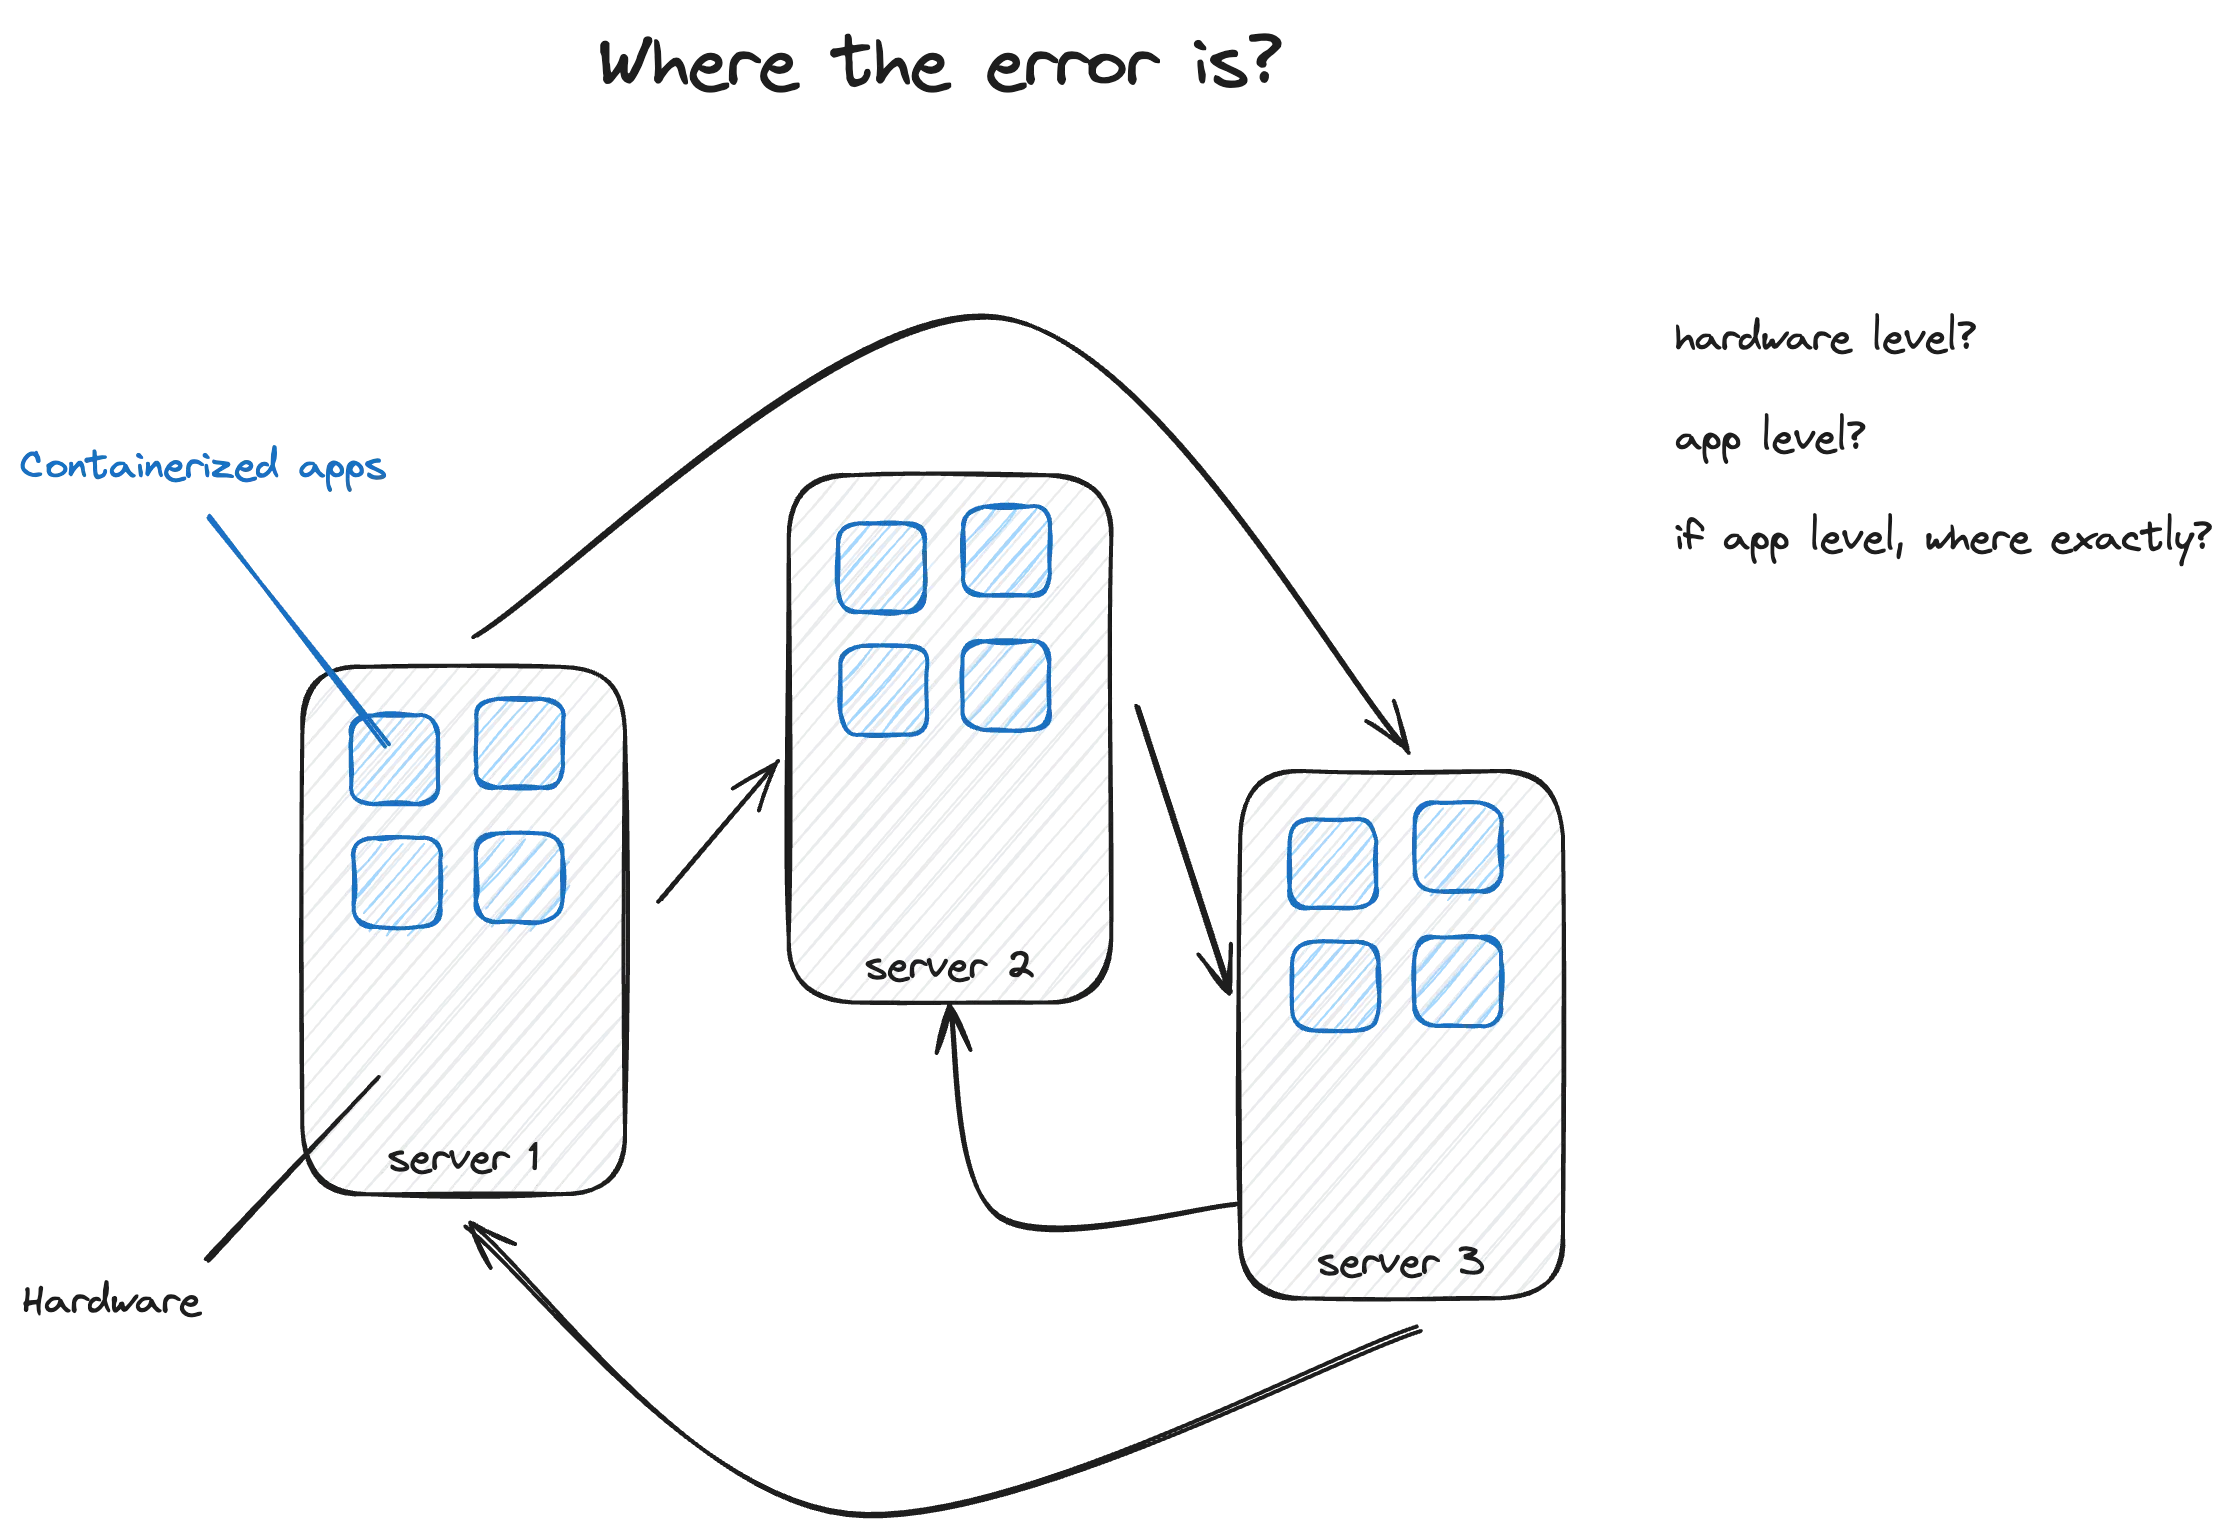
Prometheus helps by automatically watching over servers and containers, making sure everything runs smoothly. It’s crucial for avoiding system crashes and quickly fixing any problems that pop up.
Prometheus server
Prometheus has three main parts:
- Retrieval - pulls metrics from apps, services, servers etc.
- Storage - stores metrics data (time series db).
- HTTP server - contains web UI that uses API to query and show data. Exposed API can be used by external platforms like Grafana.
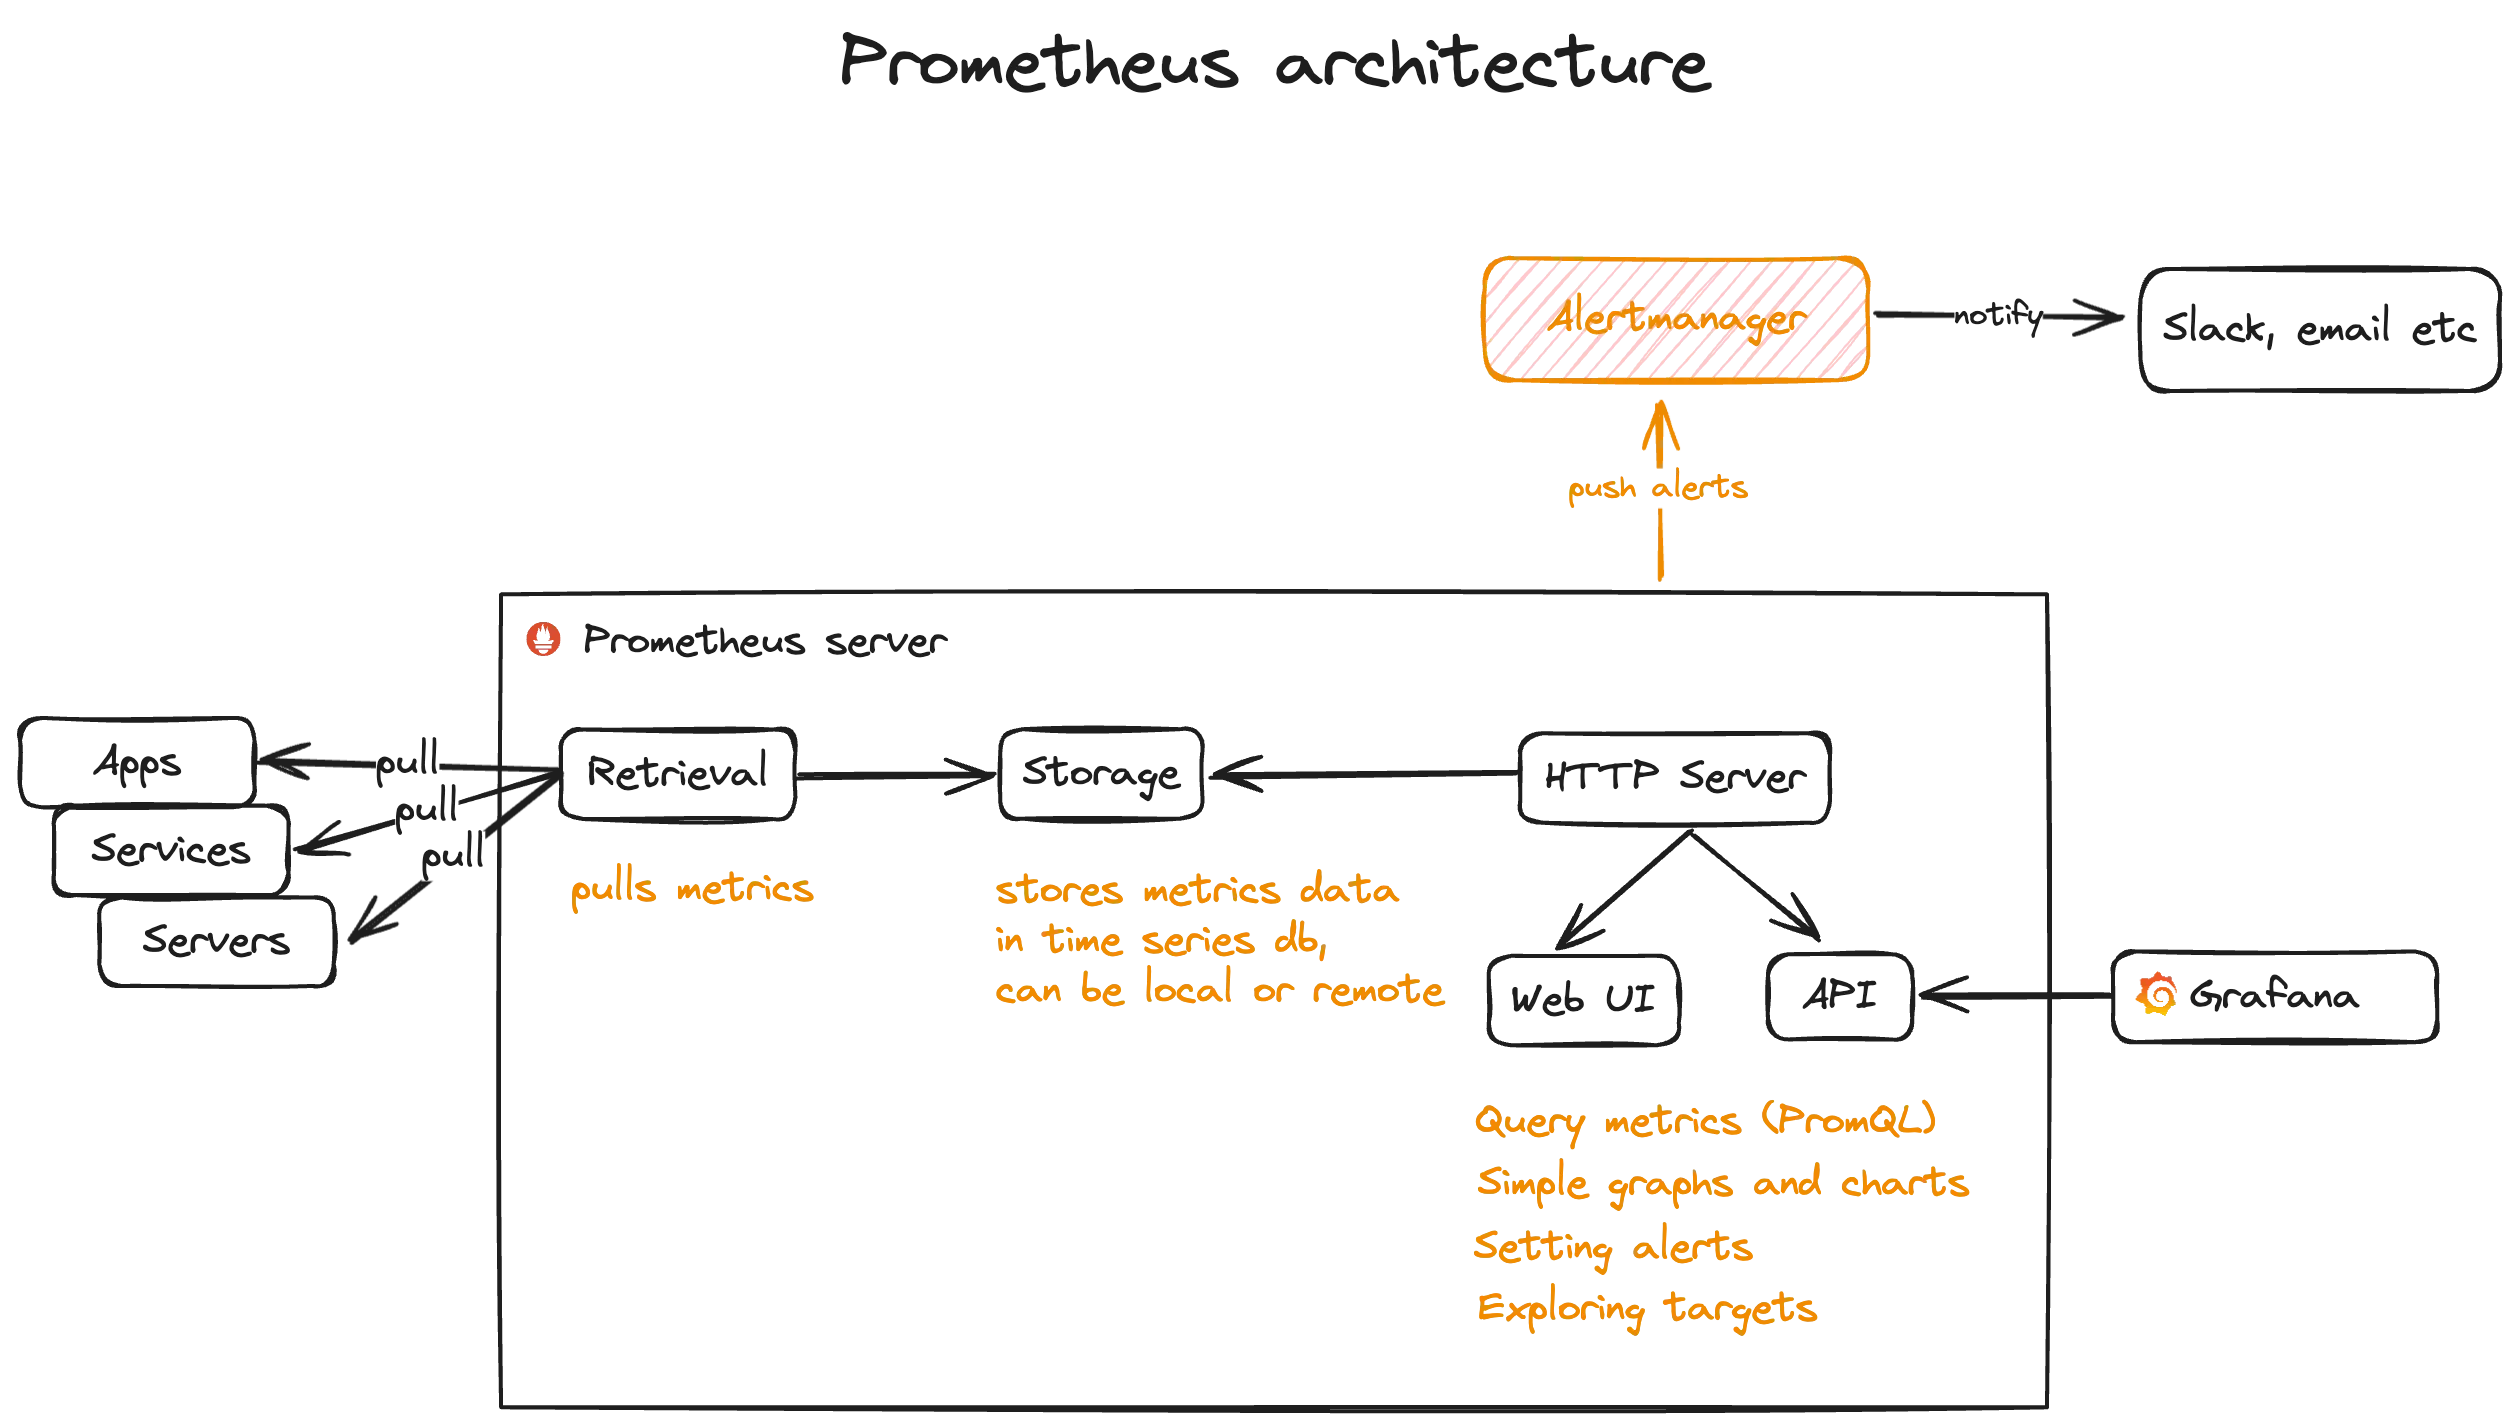
Part 1: Retrieval
In Prometheus, retrieval refers to the process of collecting metrics data from targets, which are the entities being monitored. Retrieval involves querying the endpoints exposed by these targets to fetch metrics data in a specific format. Prometheus uses HTTP to pull metrics from targets, typically at regular intervals defined in the configuration.
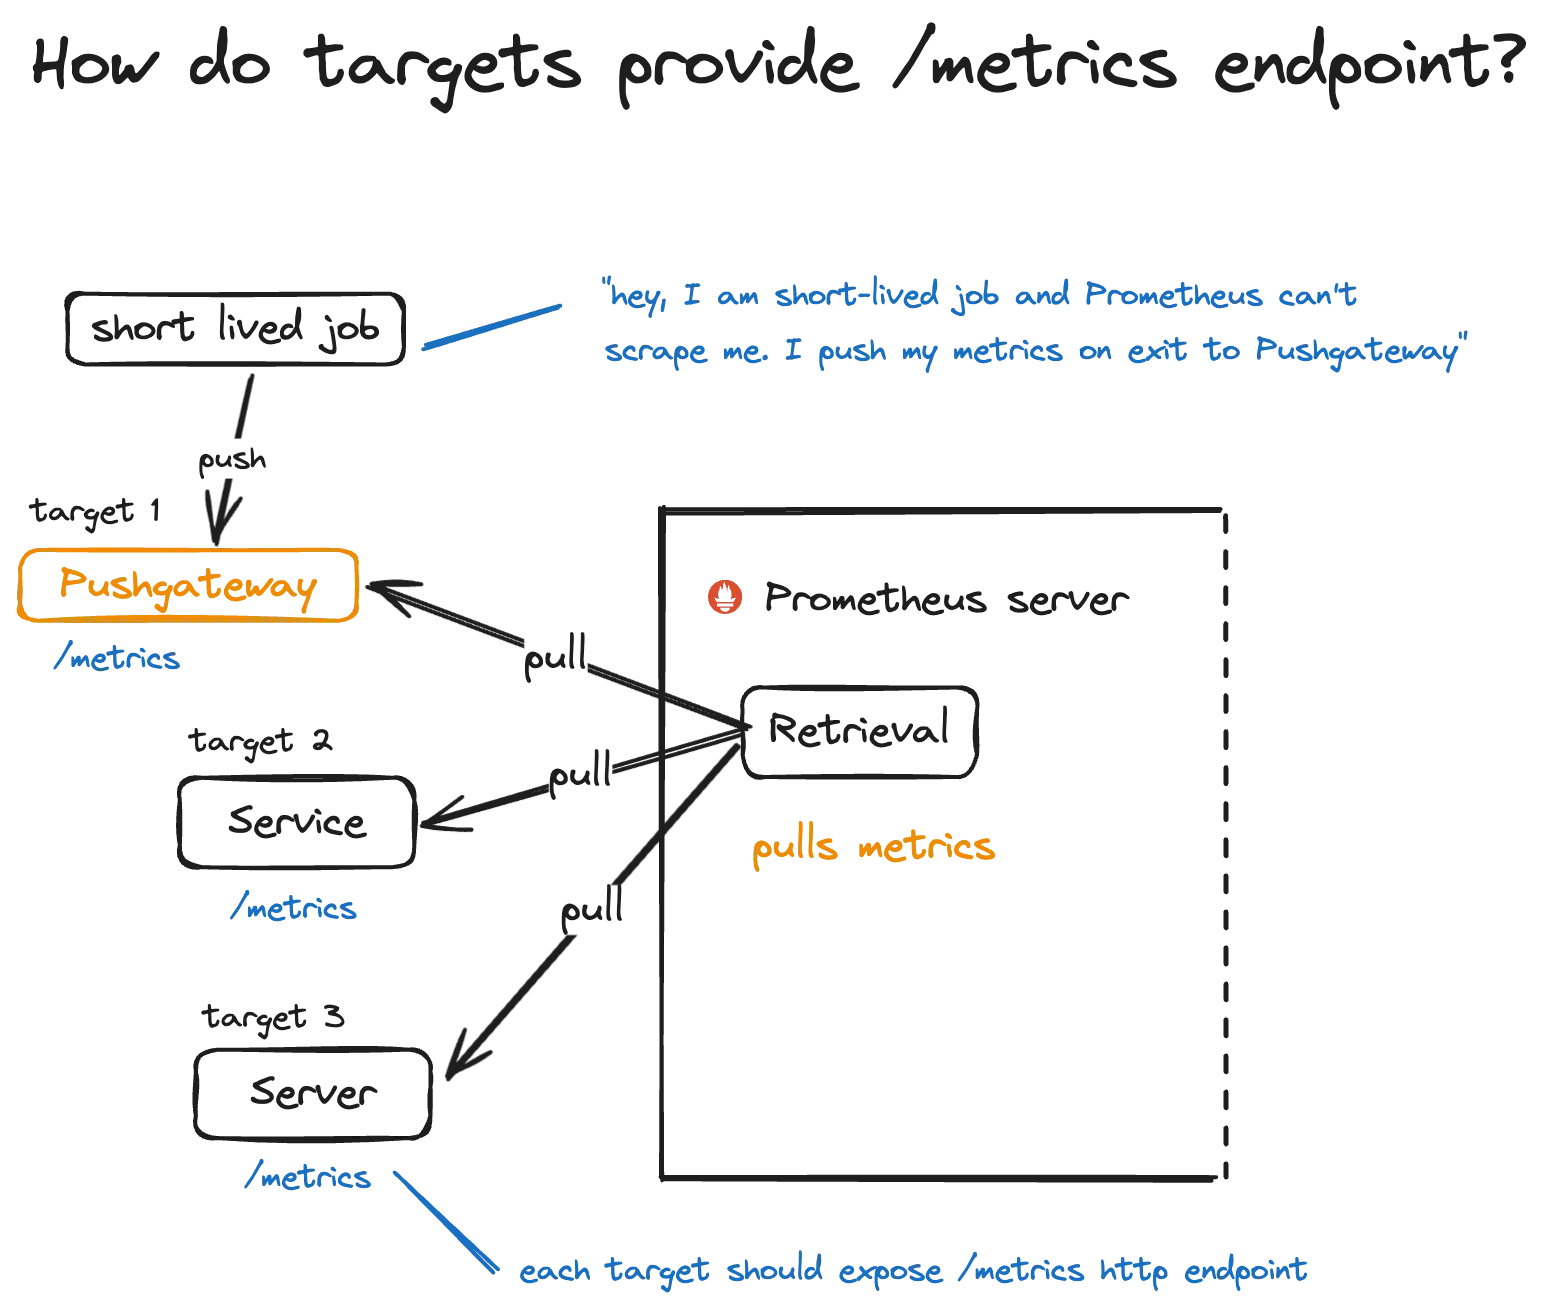
Metrics endpoint and Exporters
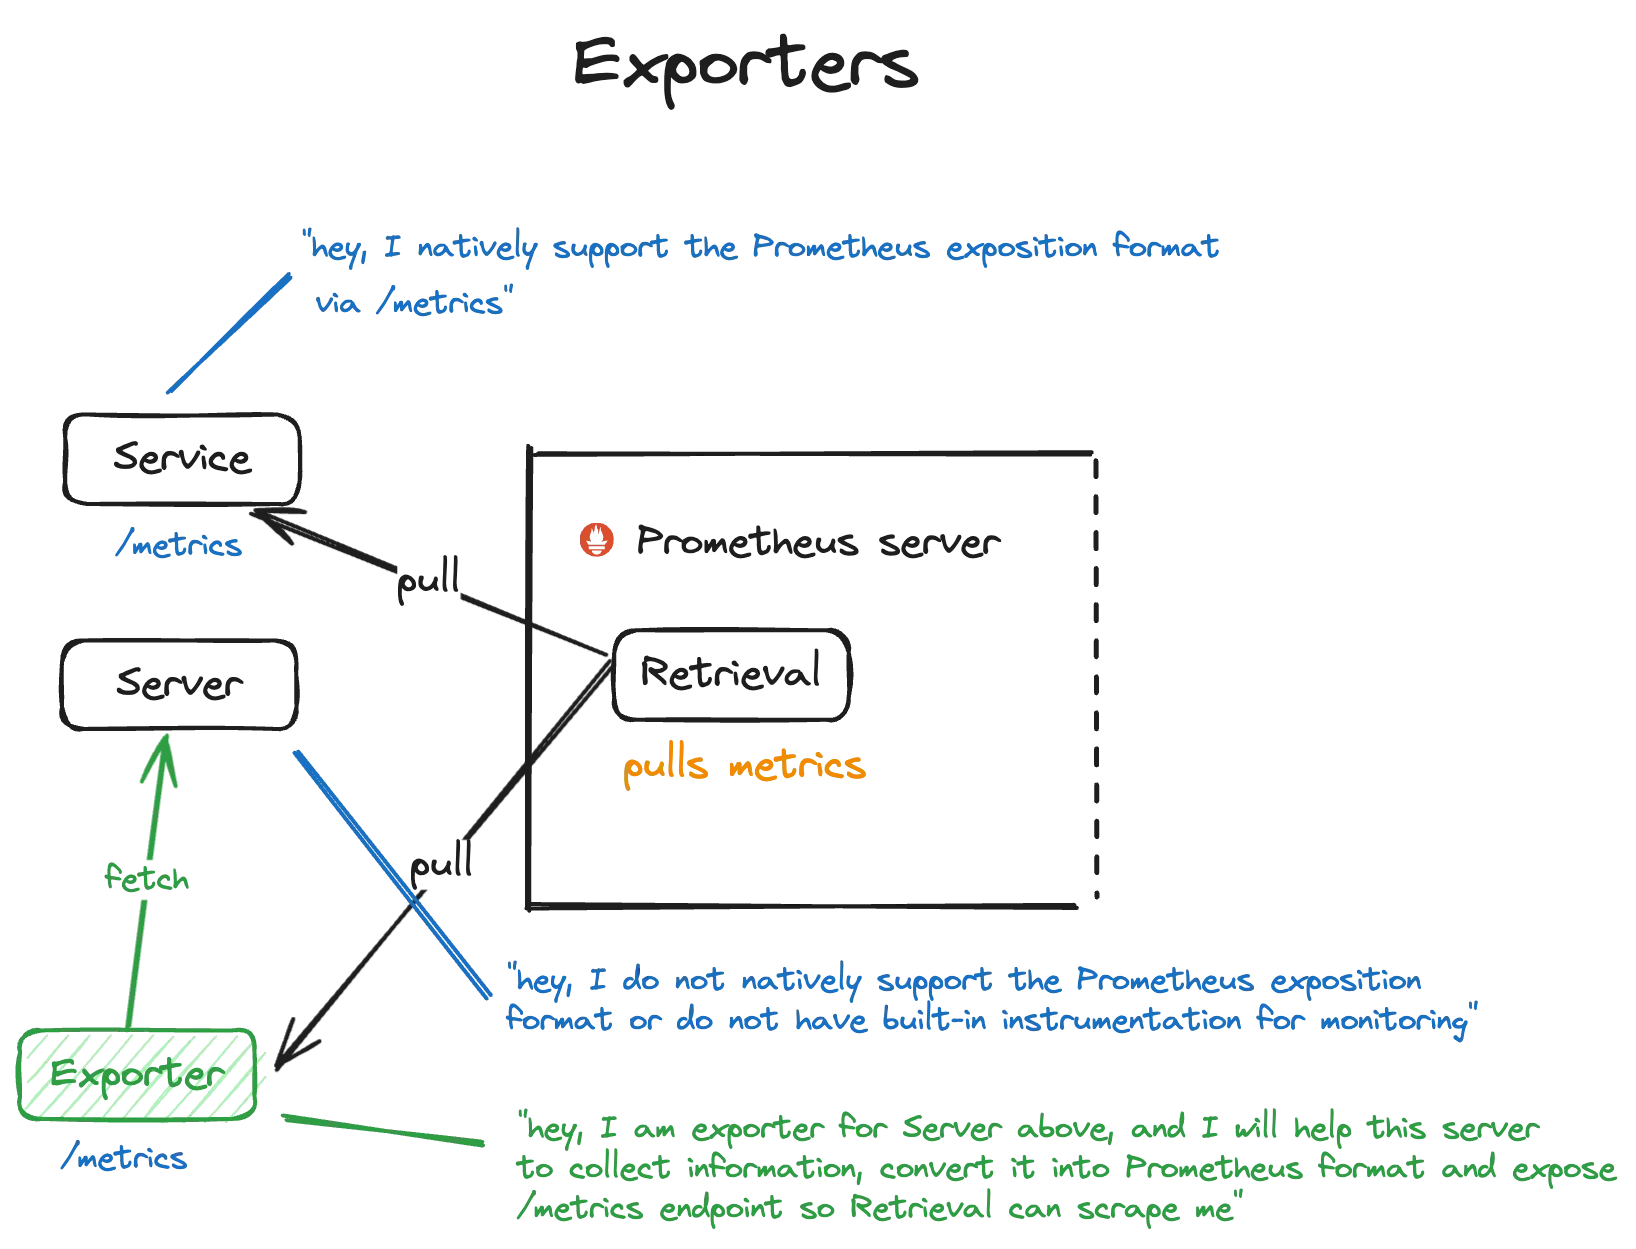
By implementing an HTTP server with the /metrics endpoint and formatting metrics data according to the Prometheus exposition format, targets enable Prometheus to collect metrics information from them effectively.
Some services natively support Prometheus’s /metrics exposition, while others do not. In cases where services do not support it, exporters come into play. Exporters are additional components used to expose metrics data from systems or services that lack built-in support for the Prometheus exposition format or lack instrumentation for monitoring.
Service discovery
What if our set of targets is dynamic? Prometheus discovers targets through a process called service discovery. This automated mechanism allows Prometheus to find and monitor the endpoints (targets) that expose metrics.
Service discovery works by periodically querying various systems or platforms to identify targets based on predefined criteria. These criteria could include DNS records, Kubernetes services, AWS EC2 instances, or other metadata provided by a cloud provider or orchestration system.
For example, in a Kubernetes environment, Prometheus can automatically discover and monitor new pods or services as they are deployed or scaled up.
Once Prometheus identifies the targets through service discovery, it begins scraping metrics from them at regular intervals to collect and store the data for monitoring and analysis. This automated discovery process simplifies monitoring in dynamic environments where targets may be added or removed frequently, ensuring that Prometheus stays up-to-date with the infrastructure it monitors.
Metrics format
In Prometheus, metrics are presented in a text-based format known as the Prometheus exposition format. This format is human-readable and standardized, making it easy for Prometheus to parse and process metrics data. Here’s an overview of the key components of the Prometheus metrics format:
- Metric Name: Each metric has a unique name that identifies the type of data being collected. Metric names should be descriptive and represent the aspect of the system or service being measured. For example, http_requests_total might represent the total number of HTTP requests handled by a web server.
- Labels: Labels provide additional metadata associated with a metric, allowing for more detailed categorization and filtering of metrics data. Labels consist of key-value pairs that provide context about the metric. For instance, a metric http_requests_total might have labels such as method=“GET” and status=“200” to differentiate between different types of requests and response statuses.
- Timestamp: Each metric data point includes a timestamp indicating when the data was collected. This allows Prometheus to track changes in metric values over time and perform time-based analysis.
- Value: The value component of a metric represents the actual measurement or observation being recorded. This could be a counter, gauge, histogram, or summary, depending on the type of metric and the data being collected. For example, a counter might represent the total number of requests processed, while a gauge could represent the current system memory usage.
- Comments: Comments can be included in the metrics data to provide additional information or context for human readers. Comments are prefixed with a # symbol and are ignored by Prometheus when processing metrics data. During retrieval, Prometheus retrieves metrics data from targets’ /metrics endpoint, where the metrics are exposed. It collects various types of metrics, such as CPU usage, memory consumption, request counts, and custom application-specific metrics.
# HELP http_requests_total Total number of HTTP requests.
# TYPE http_requests_total counter
http_requests_total{method="GET", status="200"} 100
http_requests_total{method="POST", status="200"} 50
http_requests_total{method="GET", status="404"} 5
Datamodel
-
Gauge A gauge is a type of metric used in Prometheus to represent a single numerical value that can go up or down over time. It is commonly used to track values that can fluctuate, such as CPU usage, memory usage, or the number of active connections.
-
Counters A counter is a type of metric used in Prometheus to represent a cumulative value that only increases over time. It is commonly used to track values that continuously accumulate, such as the total number of requests processed or the total number of events occurred.
-
Histograms Histograms in Prometheus are a way to track and analyze the distribution of values over a range. Imagine you have a group of people and you want to know their ages. Instead of just getting the average age, a histogram would break down the ages into different groups, like ages 0-10, 11-20, 21-30, and so on. This gives you a more detailed picture of the age distribution rather than just a single average number.
In Prometheus, histograms are used to measure the distribution of values for metrics like response times, request sizes, or database query durations. Instead of just looking at the average or total, histograms break down the values into buckets or intervals. Each bucket represents a range of values, and Prometheus counts how many observations fall into each bucket.
For example, if you’re measuring response times for a web server, you might have buckets for response times under 100 milliseconds, 100-200 milliseconds, 200-500 milliseconds, and so on. This allows you to see not only the average response time but also how many requests fall into different time ranges, helping you understand the variability and performance characteristics of your system.
# HELP http_request_duration_seconds Histogram of HTTP request durations.
# TYPE http_request_duration_seconds histogram
http_request_duration_seconds_bucket{le="0.1"} 100
http_request_duration_seconds_bucket{le="0.2"} 150
http_request_duration_seconds_bucket{le="0.5"} 200
http_request_duration_seconds_bucket{le="1.0"} 250
http_request_duration_seconds_bucket{le="+Inf"} 300
http_request_duration_seconds_sum 50
http_request_duration_seconds_count 300
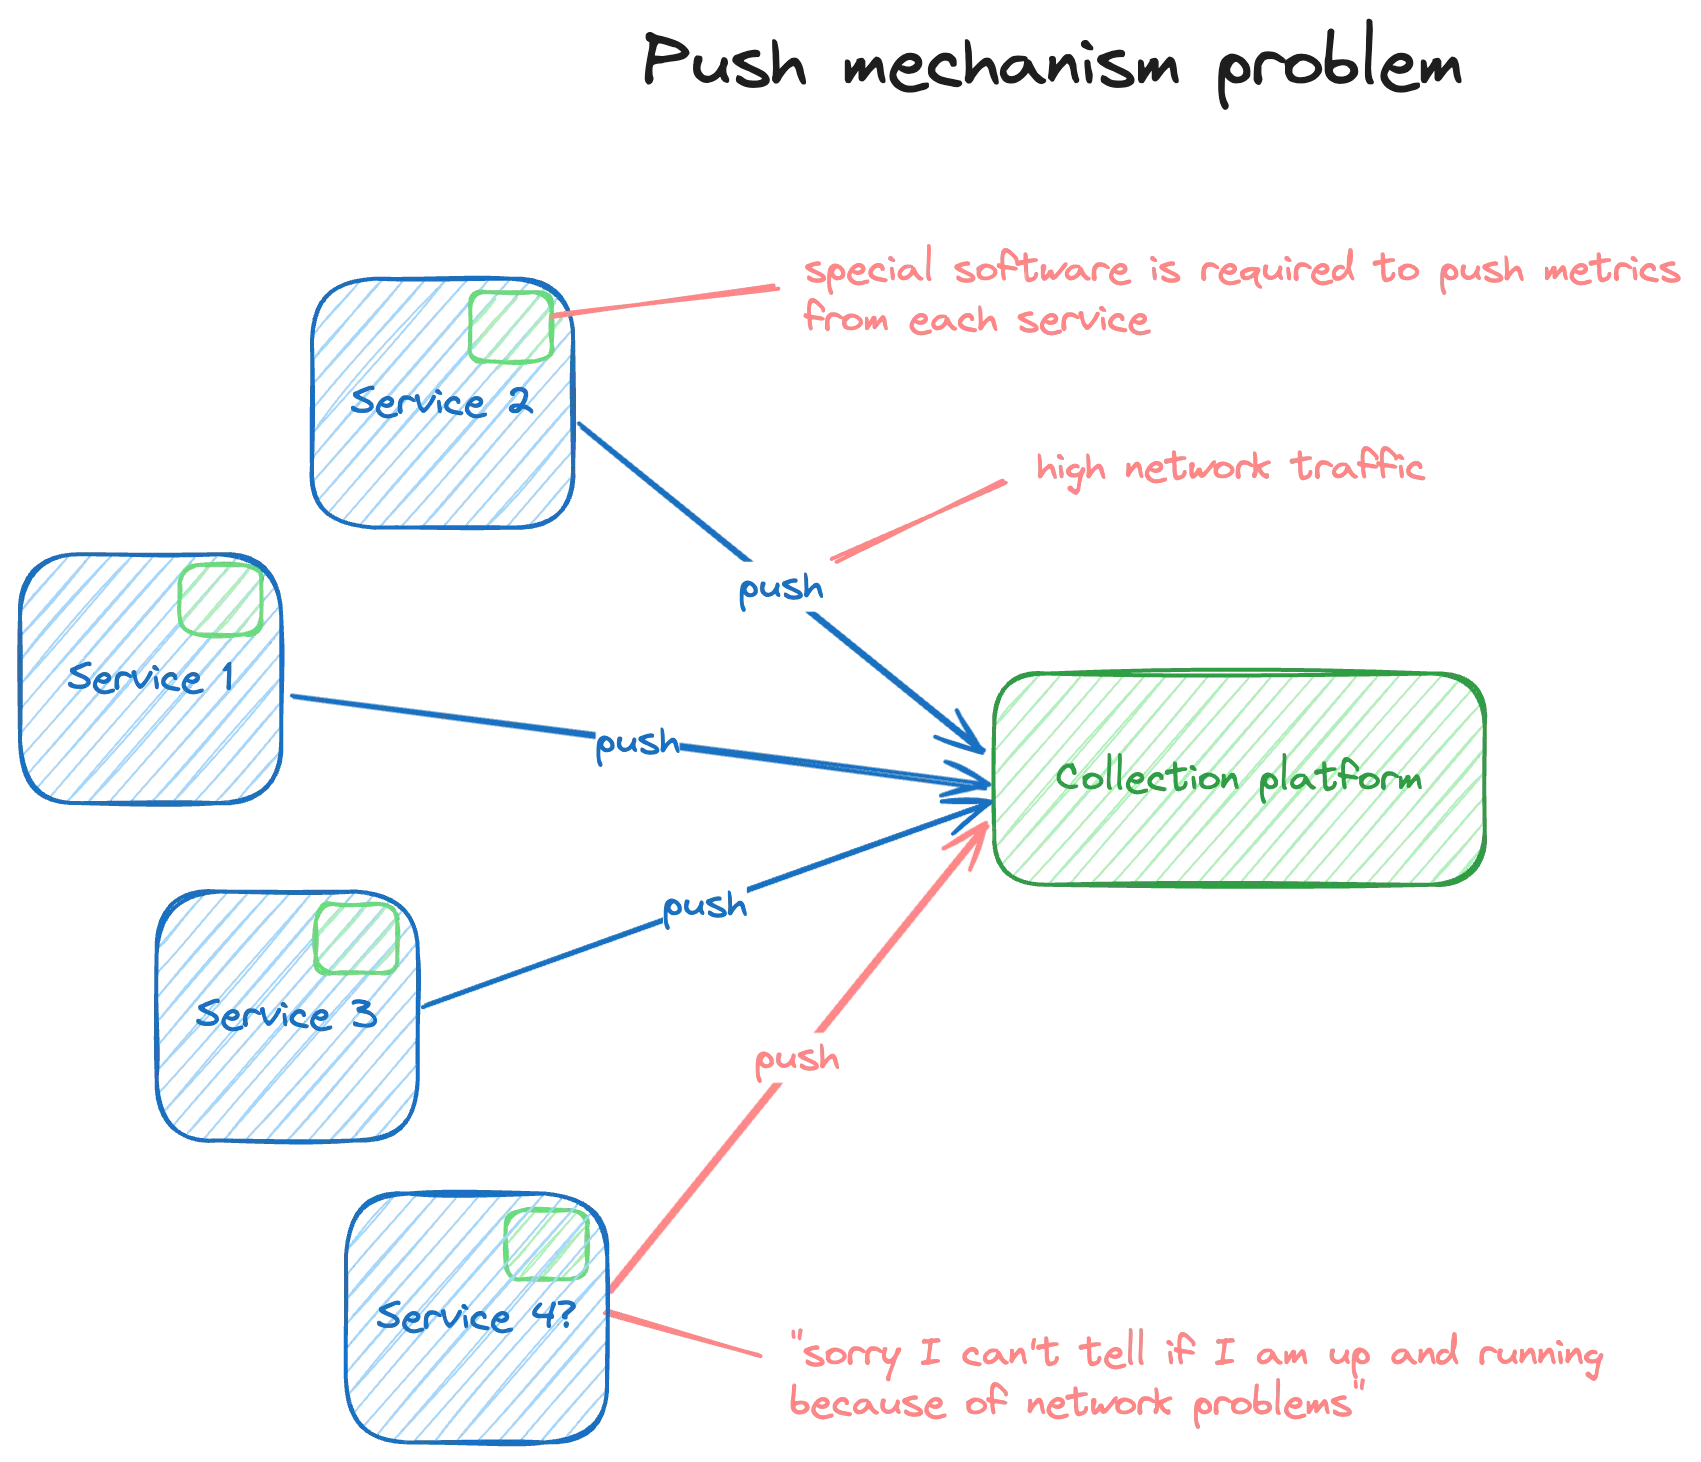
Pull-model
Pull Mechanism - advantage of Prometheus. Unlike other tools that wait for data to be sent to them, Prometheus actively goes out and gets the information it needs. This helps avoid overwhelming your network with too much data.
Part 2: Storage
Prometheus offers two storage options: local on-disk and remote storage.
-
Local On-Disk Storage: Metrics data is stored directly on the local filesystem. This option provides fast read/write operations, suitable for small to medium-sized deployments.
-
Remote Storage: Prometheus integrates with external storage solutions for long-term retention and scalability. It supports various systems like object storage services or time-series databases. Remote storage is ideal for larger deployments or strict data retention policies.
These storage options provide flexibility, performance, and scalability for storing and querying metrics data, catering to diverse monitoring needs.
Part 3: HTTP Server
The Prometheus HTTP server is a core component responsible for handling HTTP requests, serving metrics data, and providing a web-based interface for querying and visualization.
It exposes endpoints for scraping metrics data from monitored targets and serves the Prometheus expression browser, allowing users to interactively query and explore metrics data using PromQL.
The HTTP server also supports features like service discovery, alerting, and remote storage integration, making it a central hub for monitoring and managing Prometheus metrics data.
PromQL
Prometheus Query Language, is a powerful query language used to retrieve and manipulate time-series data stored in Prometheus. It allows users to perform various operations, such as filtering, aggregating, and transforming metrics.
sum(rate(http_requests_total{job="webserver"}[5m])) by (status)This query calculates the per-second rate of HTTP requests for a specific job (e.g., “webserver”) over the last 5 minutes ([5m]). It then sums up these rates based on the HTTP status codes, grouping the results by status.
Let me break it down:
http_requests_total {job="webserver"}: This selects thehttp_requests_totalmetric for the job named “webserver”.rate(...): This calculates the per-second rate of change of the selected metric over the specified time range ([5m] for the last 5 minutes).sum(...) by (status): This sums up the rates based on the HTTP status codes (status label) and groups the results by status.
This query provides insights into the request rate distribution by HTTP status code for the “webserver” job over the last 5 minutes.
Alertmanager
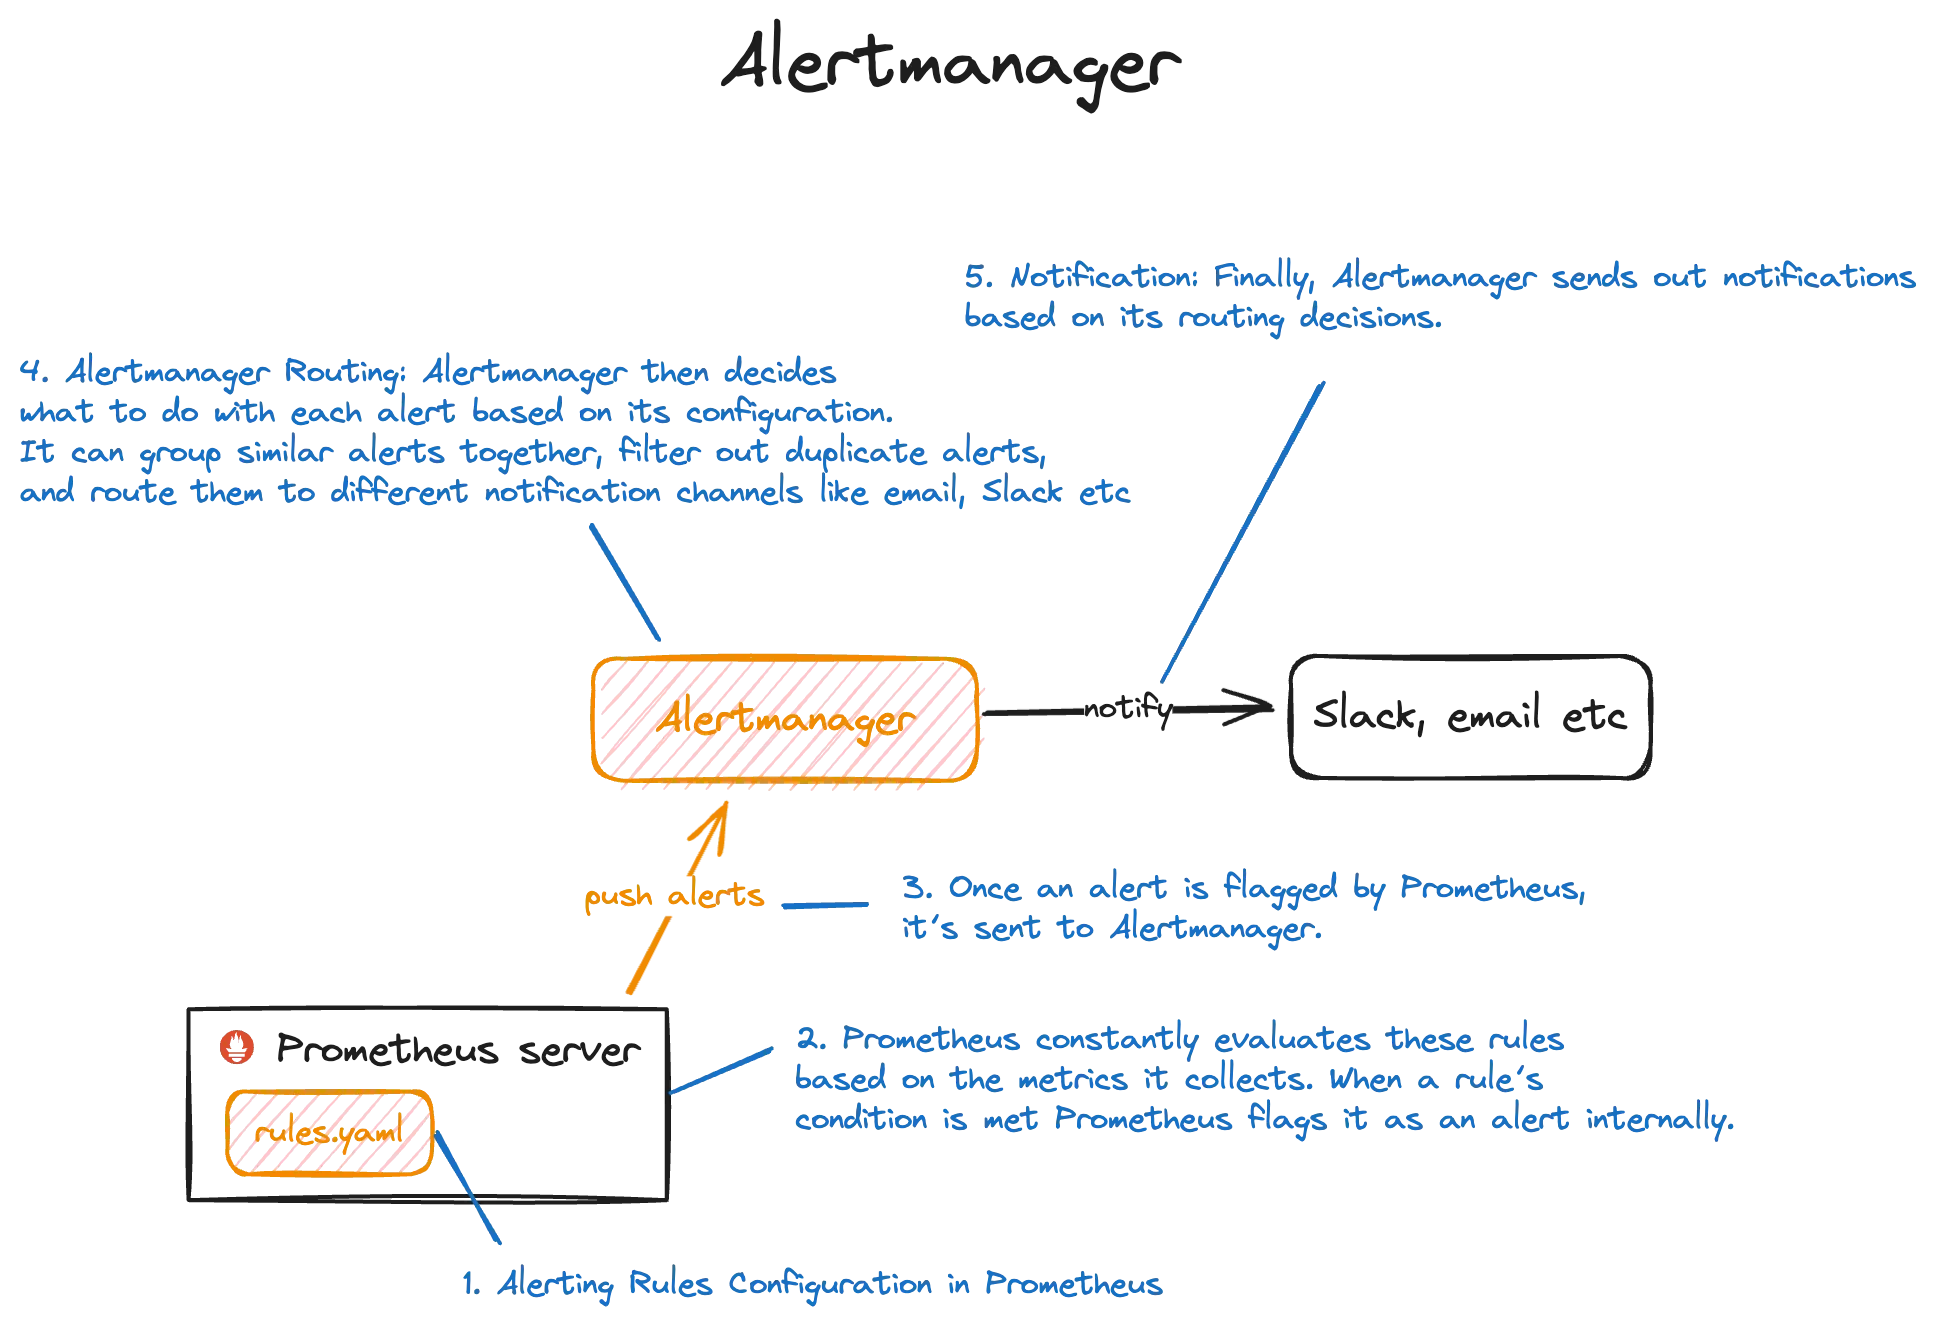
Alertmanager is a vital component of the Prometheus ecosystem, responsible for handling alerts generated by Prometheus and managing their routing and notification. It enables users to define alerting rules in Prometheus and configure various channels for alert delivery, such as email, Slack, PagerDuty, etc.
Importantly, Alertmanager is not a single, fixed solution, but rather a pluggable component, allowing users to choose different Alertmanager implementations based on their specific needs and preferences. This flexibility enables users to tailor their alerting workflows to their environment and integrate with different notification systems as required.
Let’s break it down:
-
Step 1 - Alerting Rules Configuration in Prometheus: You set up rules in Prometheus to define conditions for when alerts should be triggered. For example, you might create a rule that says “send an alert if CPU usage exceeds 90% for more than 5 minutes.”
-
Step 2 - Evaluation by Prometheus: Prometheus constantly evaluates these rules based on the metrics it collects. When a rule’s condition is met (e.g., CPU usage is indeed above 90% for more than 5 minutes), Prometheus flags it as an alert internally.
-
Step 3 - Alert Sent to Alertmanager: Once an alert is flagged by Prometheus, it’s sent to Alertmanager. Think of Alertmanager as the alert dispatcher—it receives alerts from Prometheus.
-
Step 4 - Alertmanager Routing: Alertmanager then decides what to do with each alert based on its configuration. It can group similar alerts together, filter out duplicate alerts, and route them to different notification channels like email, Slack, or PagerDuty.
-
Step 5 - Notification: Finally, Alertmanager sends out notifications based on its routing decisions. For example, if an alert is critical, it might notify the on-call engineer via a phone call or a loud alarm, while less critical alerts might be sent as an email or a message in a team’s Slack channel.
So, in simple terms, Prometheus decides when to raise alerts based on predefined rules, and Alertmanager handles how those alerts are sent out and to whom.
What to configure?
To run Prometheus, you typically need to configure several key components:
-
prometheus.yml: This is the main configuration file for Prometheus. It specifies parameters such as the scrape targets (services or endpoints from which Prometheus collects metrics), scrape intervals, alerting rules, and storage configurations. It’s crucial for defining how Prometheus collects, stores, and processes metrics.
-
Scrape Targets: These are the services or endpoints from which Prometheus collects metrics. You need to specify these targets in the
prometheus.ymlconfiguration file. Targets can include HTTP endpoints, exporters, or other Prometheus instances. -
Alerting Rules: If you want to set up alerting in Prometheus, you’ll need to define alerting rules in the
prometheus.ymlfile. These rules specify conditions that trigger alerts when certain thresholds or conditions are met. -
Storage Configuration: Prometheus stores time-series data locally on disk. You can configure parameters related to storage, such as retention periods (how long to keep data), retention policies, and storage paths.
-
Alertmanager Configuration: If you plan to use the Alertmanager with Prometheus for alerting, you’ll need to configure Alertmanager separately. This includes defining notification channels (such as email, Slack, or PagerDuty), routing rules, and integration settings.
-
Service Discovery Configuration: If you’re using service discovery mechanisms (such as Kubernetes service discovery or file-based service discovery), you may need to configure these mechanisms to automatically discover scrape targets.
These are some of the key configuration pieces needed to run Prometheus effectively. Configuration may vary depending on your specific use case, infrastructure setup, and monitoring requirements. It’s essential to review the Prometheus documentation and best practices to configure Prometheus properly for your environment.
Conclusion
In conclusion, dissecting the components of Prometheus individually and understanding each can swiftly enhance comprehension.
By unraveling its architecture piece by piece, users can grasp the intricacies of Prometheus with greater clarity, paving the way for effective monitoring and management of their infrastructure.